
Check CPU Temp? Expert Methods Explained
How to Check CPU Temperature: Expert Methods Explained
Your computer’s processor is one of the most critical components, and monitoring its temperature is essential for maintaining optimal performance and longevity. Whether you’re a casual user, a gamer, or someone who runs demanding applications, knowing how to check CPU temperature can help you prevent hardware damage, identify cooling issues, and ensure your system runs smoothly. High CPU temperatures can lead to thermal throttling, reduced performance, unexpected shutdowns, and permanent damage to your processor.
In this comprehensive guide, we’ll walk you through multiple methods to monitor your CPU temperature, from built-in operating system tools to specialized third-party software. You’ll learn what temperatures are considered safe, how to interpret the data you collect, and what steps to take if you discover your CPU is running too hot. Let’s dive into the practical solutions that will help you keep your system in peak condition.
Understanding CPU Temperature Basics
Before you start checking your CPU temperature, it’s important to understand what you’re actually measuring and why it matters. Modern processors have built-in temperature sensors called thermal diodes that continuously monitor heat levels. These sensors are integrated directly into the CPU die and provide real-time data about your processor’s thermal state.
CPU temperature is measured in degrees Celsius (°C) or Fahrenheit (°F), and different processors have different operating parameters. The temperature you see reported is typically the core temperature, which represents the heat at the processor’s core rather than the surrounding environment. This distinction is crucial because ambient room temperature can be significantly different from your CPU’s actual operating temperature.
Understanding the relationship between CPU load and temperature is also essential. When your processor is idle or performing light tasks, temperatures will be lower. During intensive operations like gaming, video rendering, or data processing, your CPU will generate more heat and temperatures will rise accordingly. This is completely normal, and your cooling system is designed to handle these fluctuations.
There are several ways to access CPU temperature data, each with its own advantages and limitations. Some methods require you to restart your computer and enter firmware settings, while others provide real-time monitoring from within your operating system. The method you choose depends on your technical comfort level and how frequently you want to monitor temperatures.
Using BIOS/UEFI to Monitor CPU Temperature
The most direct way to check your CPU temperature is through your computer’s BIOS (Basic Input/Output System) or UEFI (Unified Extensible Firmware Interface). These firmware interfaces sit between your hardware and operating system, and they have direct access to your CPU’s temperature sensors. Here’s how to access this information:
- Restart your computer and immediately begin pressing the appropriate key to enter BIOS/UEFI setup. Common keys include Delete, F2, F10, or F12, depending on your motherboard manufacturer.
- Navigate to the monitoring section, which might be labeled “Hardware Monitor,” “PC Health Status,” “System Information,” or “Advanced” depending on your specific BIOS version.
- Look for CPU temperature readings displayed as “CPU Temperature,” “Package Temperature,” or “Core Temperature.”
- Document the readings while your system is idle and note the maximum temperature during startup.
- Exit BIOS/UEFI by pressing the appropriate key (usually Escape or by selecting “Exit Without Saving”) and allow your system to boot normally.
The advantage of checking BIOS/UEFI is that you’re getting raw sensor data without any operating system interference. However, this method only shows you temperature at that specific moment, not how it fluctuates during normal use. For ongoing monitoring, you’ll need to use software-based solutions that we’ll discuss next.
Many modern motherboards also display temperature information on the boot screen before Windows or Linux fully loads. This can give you a quick snapshot of your CPU’s thermal state during startup, which is often when temperatures are more stable.
Windows Built-in Temperature Monitoring
Windows doesn’t provide a dedicated temperature monitoring tool in the Control Panel or Settings app, but there are several built-in utilities that can help. The most useful is the Windows Subsystem for Linux (WSL) combined with Linux tools, though this requires some technical knowledge.
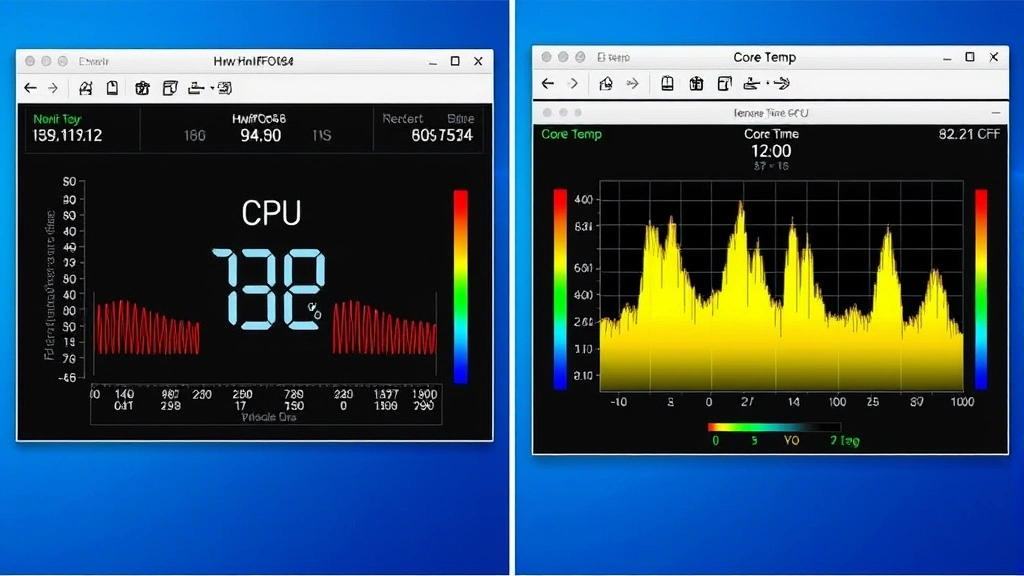
A more practical approach for most Windows users is to use HWiNFO64, which is free and provides detailed hardware information. However, if you want to stick with Microsoft’s ecosystem, you can use the Task Manager in a limited capacity. While Task Manager doesn’t show CPU temperature directly, it shows CPU usage, which correlates with temperature generation.
For real-time temperature monitoring within Windows, many users turn to the HWMonitor utility from TechPowerUp, which reads your system’s hardware monitoring chips and displays CPU temperature alongside other vital statistics. This tool is lightweight and doesn’t require installation, making it perfect for quick temperature checks.
Windows 11 users might also find that some hardware manufacturers provide their own monitoring software through the Microsoft Store. If you built your PC with a specific motherboard brand, check the manufacturer’s website for proprietary monitoring tools that are optimized for your hardware.
Third-Party Software Solutions
Third-party software offers the most comprehensive and user-friendly temperature monitoring options. These applications provide real-time data, historical graphs, customizable alerts, and often include additional system information. Here are the most reliable options:
CPU-Z and GPU-Z are industry-standard tools that provide detailed processor information, including temperature readings. While primarily designed for hardware identification and validation, these tools include temperature monitoring capabilities that update in real-time. They’re free, lightweight, and trusted by millions of users.
Speccy from CCleaner is another excellent option that displays comprehensive system information including CPU temperature, fan speeds, and thermal specifications. The interface is intuitive and provides both current and maximum temperatures recorded during your monitoring session.
Core Temp is specifically designed for temperature monitoring and provides per-core temperature readings for processors with multiple cores. This is particularly useful if you want to identify whether certain cores are running hotter than others, which can indicate uneven cooling or thermal paste application issues.
Open Hardware Monitor is an open-source solution that monitors temperature, fan speeds, voltages, and clock speeds. Because it’s open-source, the code is publicly available for review, which appeals to users concerned about privacy and security. It supports most modern processors and provides graphical displays of temperature trends.
When selecting monitoring software, consider whether you want real-time alerts that notify you when temperatures exceed safe thresholds. Many premium options include this feature, allowing you to take action immediately if your CPU starts overheating. Some software can even automatically shut down your system if temperatures reach critical levels, protecting your hardware from damage.
Mac and Linux Temperature Monitoring
Mac users have fewer native options compared to Windows, but several solutions are available. Macs Fan Control provides CPU temperature monitoring along with fan speed control, making it ideal for users who want comprehensive thermal management. The app displays real-time temperatures and historical data.
Fanny is a lightweight menu bar app for Mac that shows CPU and GPU temperatures in your system tray. It’s minimal and unobtrusive, perfect if you want constant temperature awareness without a dedicated window.
Linux users have the most flexibility with command-line tools. The lm-sensors package provides detailed thermal information when installed and can be queried from the terminal. For graphical interfaces, psensor offers a user-friendly temperature display with graphing capabilities. Depending on your Linux distribution, you might also find temperature information in system monitoring applications like GNOME System Monitor or KDE Plasma’s system information tools.
For Linux, you can often check CPU temperature using the command line by reading the /sys/class/thermal/ directory or using tools like cat /proc/cpuinfo combined with thermal zone information. This direct access to hardware data is one of the advantages of Linux for advanced users who want precise control over system monitoring.
Interpreting Temperature Readings
Once you’ve gathered CPU temperature data, you need to understand what the numbers mean. Modern CPUs have multiple temperature sensors, and you might see readings labeled differently depending on your monitoring tool.
Package Temperature represents the overall heat output of the entire processor package and is the most important metric for thermal management. Core Temperature shows the temperature of individual processor cores and can vary between cores. Junction Temperature (Tj) is the maximum temperature at which the CPU can safely operate and varies by processor model.
When interpreting readings, always reference your specific processor’s specifications. You can find this information by searching your processor model on the manufacturer’s website (Intel or AMD). Different processors have different maximum safe temperatures, ranging from 85°C to 105°C depending on the model.
It’s important to understand the difference between instantaneous temperature (what you see right now) and sustained temperature (what your CPU runs at under load for extended periods). A brief spike to 85°C while gaming might be normal, but if your CPU consistently runs at 85°C during normal browsing, you have a cooling problem that needs addressing.
Safe Temperature Ranges
Understanding what constitutes a safe temperature range is critical for protecting your hardware investment. Here’s a comprehensive breakdown of CPU temperature guidelines:
- Idle Temperatures (20-40°C): When your computer is running but not performing demanding tasks, your CPU should run at or near room temperature plus a small margin. Readings in the 20-40°C range are excellent and indicate your cooling system is working efficiently.
- Light Load Temperatures (40-60°C): During normal activities like web browsing, email, document editing, and media playback, your CPU should remain in this range. If temperatures exceed 60°C during light tasks, your cooling system may need maintenance.
- Medium Load Temperatures (60-80°C): Gaming, video rendering, and other moderately demanding tasks typically push CPUs into this range. These temperatures are safe and expected, though sustained operation at the upper end of this range suggests your cooling system is working hard.
- High Load Temperatures (80-95°C): During extremely demanding workloads, modern CPUs can safely operate in this range for extended periods. However, prolonged operation at these temperatures can reduce processor lifespan and may trigger thermal throttling.
- Critical Temperatures (95°C+): These temperatures are dangerous and indicate your cooling system is failing. Your CPU will likely throttle performance significantly, and continued operation at these levels risks permanent hardware damage.
It’s worth noting that newer processors (Intel 12th gen and newer, AMD Ryzen 5000 series and newer) tend to run hotter than previous generations while still remaining within safe operating parameters. Always check your specific processor’s maximum operating temperature rather than relying on general guidelines. If you’re concerned about your setup, you can visit Intel’s specification lookup tool or AMD’s processor specifications for accurate information.
Troubleshooting High CPU Temperatures
If you discover that your CPU is running hotter than it should, don’t panic. There are several straightforward solutions you can implement to bring temperatures back to normal ranges.
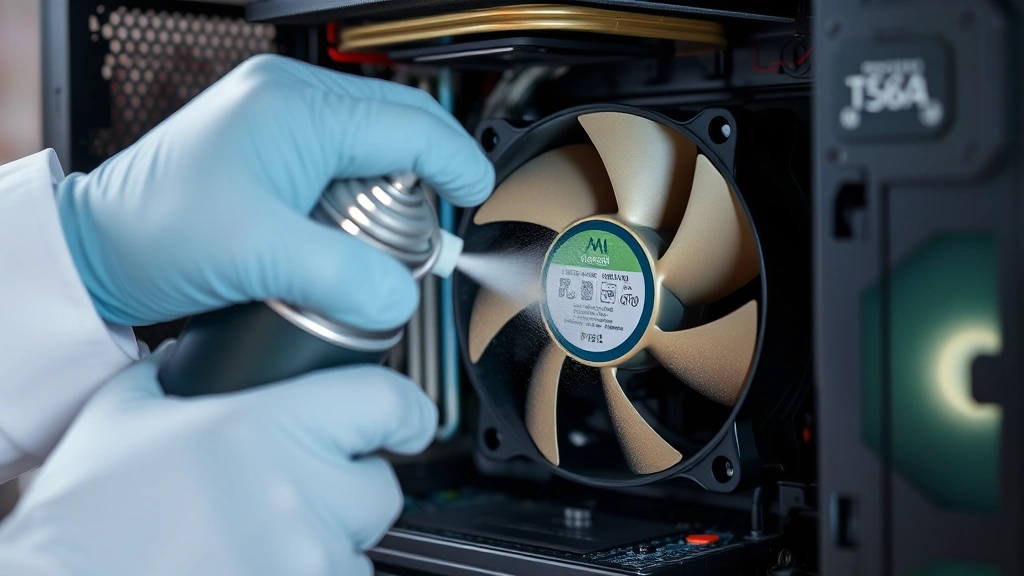
Clean Your Cooling System: Dust accumulation is the most common cause of high CPU temperatures. Over time, dust settles on your heatsink, fan blades, and case filters, restricting airflow and reducing cooling efficiency. Power down your computer completely, open the case, and use compressed air to blow dust out of the heatsink fins, fan blades, and case fans. This simple maintenance task often results in 5-15°C temperature reductions.
Check Thermal Paste Application: The thermal paste between your CPU and heatsink transfers heat away from the processor. If it’s dried out, improperly applied, or degraded, thermal conductivity suffers. If you’re comfortable with hardware maintenance, consider removing your heatsink and reapplying thermal paste. Use the proper application method recommended by thermal paste manufacturers—typically a small pea-sized amount in the center of the CPU.
Improve Case Airflow: Ensure your computer case has proper intake and exhaust fans configured correctly. Cool air should enter from the front or bottom, and hot air should exit from the rear or top. Remove any obstructions blocking fan vents and ensure your computer isn’t placed in an enclosed space that restricts air circulation.
Upgrade Your Cooling Solution: If your CPU is a high-performance processor and you’re using the stock cooler, upgrading to an aftermarket air cooler or liquid cooling solution can significantly reduce temperatures. Visit your motherboard manual to confirm compatibility before purchasing a new cooler.
Reduce Ambient Temperature: The room temperature where your computer operates directly affects CPU temperatures. Ensure adequate ventilation in your room, avoid placing your computer near heat sources, and consider using air conditioning if you live in a hot climate.
Check for Background Processes: Sometimes high CPU temperatures result from excessive software running in the background. Open your task manager and review CPU usage to identify resource-hungry applications. Close unnecessary programs and consider disabling startup applications you don’t need.
Verify BIOS Settings: Ensure your motherboard’s BIOS isn’t configured with overly aggressive overclocking settings or disabled fan curves. If you recently modified BIOS settings, consider resetting them to defaults and gradually adjusting them for your specific needs.
For additional guidance on system maintenance, you might want to review our guide on proper cleaning techniques which emphasizes the importance of regular maintenance for optimal performance—a principle that applies equally to computer cooling systems.
FAQ
What is a normal CPU temperature?
Normal CPU temperatures vary by processor and usage level. At idle, expect 20-40°C. During light tasks, 40-60°C is normal. Gaming and demanding workloads typically generate 60-85°C. Always reference your specific processor’s maximum operating temperature for accurate comparisons.
Can checking CPU temperature damage my computer?
No, monitoring CPU temperature is completely safe. Whether you check BIOS readings, use monitoring software, or access firmware settings, you’re only reading sensor data without making any changes to hardware or settings unless you choose to.
How often should I check my CPU temperature?
Check your CPU temperature periodically, especially after opening your case for maintenance or if you notice performance issues. Many users leave monitoring software running continuously to track temperatures over time and identify trends.
Why does my CPU temperature vary so much?
CPU temperature fluctuates based on workload, ambient room temperature, fan speed adjustments, and background processes. These variations are completely normal. What matters is that temperatures stay within safe ranges for your specific processor.
Should I be worried if my CPU reaches 90°C?
Reaching 90°C during heavy gaming or rendering is generally safe for modern processors, though it indicates your cooling system is working at capacity. If you reach 90°C during light tasks, your cooling system needs attention. If temperatures exceed 95°C regularly, take immediate action to improve cooling.
Can I lower CPU temperature by adjusting fan speed?
Yes, increasing fan speed improves cooling efficiency and lowers CPU temperature. However, higher fan speeds generate more noise. Many BIOS settings and third-party tools allow you to create custom fan curves that balance temperature and noise levels based on CPU load.
What monitoring software is best for beginners?
For beginners, HWiNFO64 or Speccy are excellent choices because they provide clear, easy-to-understand interfaces displaying CPU temperature alongside other system information. Both are free and don’t require technical knowledge to use effectively.
Is it safe to use my computer if CPU temperature is high?
If temperatures are moderately high (80-90°C), your computer is safe to use, though performance may be reduced due to thermal throttling. If temperatures exceed 95°C, shut down immediately and investigate the cause before continuing use, as sustained operation at critical temperatures risks permanent hardware damage.
Related Posts

Superscript in Google Docs: Expert Tips

Strikethrough in Excel: Easy Steps for Beginners
