How to Check CPU Temperature: Easy Steps

How to Check CPU Temperature: Easy Steps for Every User
Your CPU is the beating heart of your computer, and like any hardworking engine, it generates heat. But here’s the thing—most people have absolutely no idea what temperature their processor is actually running at. You might think your computer is performing fine, but if your CPU is silently cooking itself, you’re looking at potential throttling, reduced lifespan, or even catastrophic failure down the road.
Monitoring your CPU temperature isn’t just for tech enthusiasts or overclockers anymore. Whether you’re a casual user noticing your laptop getting toasty during video calls, a gamer concerned about performance dips, or someone who simply wants to keep their machine healthy, knowing how to check CPU temperature is a practical skill that takes just a few minutes to learn.
The good news? It’s genuinely straightforward. You don’t need specialized hardware or advanced technical knowledge. In this guide, we’ll walk you through multiple methods—from built-in Windows tools to free third-party applications—so you can pick whatever works best for your situation.
Why Monitor Your CPU Temperature?
Before we jump into the how, let’s talk about the why. Your CPU has a maximum safe operating temperature—typically between 80-100°C depending on your processor model. When your processor exceeds this threshold, a few things can happen, and none of them are pleasant.
First, thermal throttling kicks in. Your CPU automatically reduces its clock speed to generate less heat. While this protects your hardware, it absolutely tanks your performance. That gaming session suddenly becomes a slideshow. Your video editing crawls. Your spreadsheet calculations take forever.
Second, prolonged high temperatures degrade your CPU over time. Silicon doesn’t like sustained heat stress any more than you like sitting in a sauna for hours. The lifespan of your processor gets shortened significantly.
Third, in extreme cases, your computer might just shut itself down to prevent permanent damage. Nothing’s worse than losing your work because your system decided it was overheating.
Regular temperature monitoring gives you early warning signs. If you notice temperatures creeping up, you can investigate the cause before it becomes a crisis. Maybe your cooling solution needs cleaning. Maybe thermal paste needs reapplication. Maybe you need better case airflow. Whatever the issue, you’ll catch it early.
Check Temperature in Windows Settings
If you’re running Windows 11 or Windows 10, Microsoft actually built basic temperature monitoring directly into the system. It’s not the most detailed information, but it’s a quick starting point.
Step 1: Open Task Manager
Press Ctrl + Shift + Esc simultaneously. This launches Task Manager directly. Alternatively, you can right-click your taskbar and select Task Manager, or press Ctrl + Alt + Delete and choose Task Manager from the menu.
Step 2: Navigate to the Performance Tab
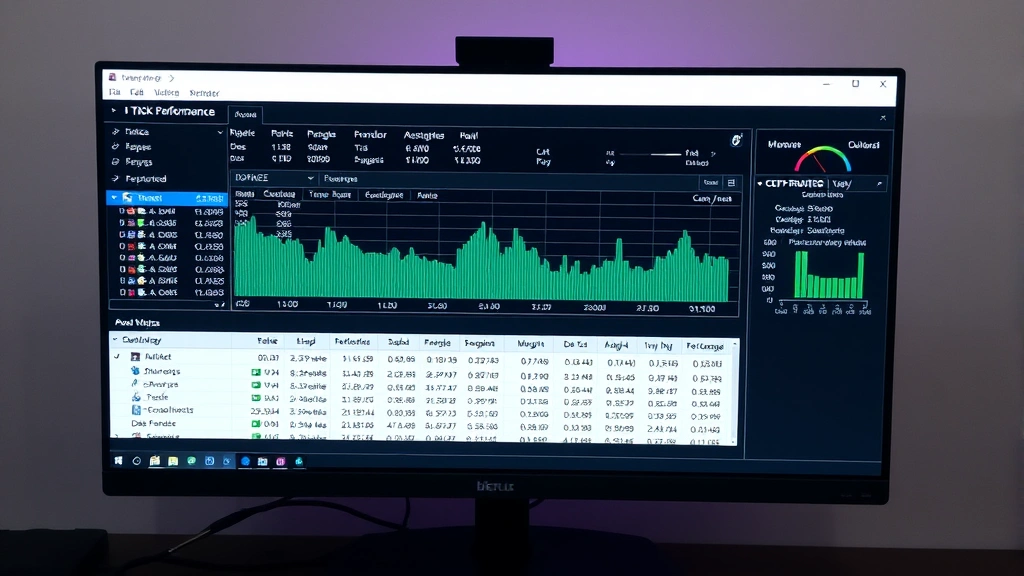
Once Task Manager opens, click the “Performance” tab at the top. You’ll see various system metrics displayed.
Step 3: Select CPU from the Left Sidebar
On the left side, you’ll see options like CPU, Memory, Disk, and GPU. Click on “CPU.” The right panel will now display CPU-specific information.
Step 4: Look for Temperature Information
In Windows 11, you should see a temperature reading displayed prominently. It typically appears in the bottom-right corner of the CPU performance graph. In Windows 10, this feature was added in later updates, so if you don’t see it, your version might not support it.
This method works great for a quick check, but it doesn’t give you historical data or detailed breakdowns by core. For more comprehensive monitoring, you’ll want to explore other options.

Checking Temperature in BIOS
Your BIOS (Basic Input/Output System) has access to all your hardware sensors, including CPU temperature data. Checking temperature here gives you readings directly from the source, without any operating system interference.
Step 1: Restart Your Computer
Save any open work and restart your computer normally.
Step 2: Enter BIOS Setup
As your computer boots, watch the screen for a message like “Press DEL to enter Setup” or “Press F2 for BIOS.” The key varies by manufacturer. Common keys include Del, F2, F10, and F12. Press the appropriate key repeatedly during startup. You’ll need to do this before Windows loads.
Step 3: Navigate to Hardware Monitoring
Once inside BIOS, look for a menu option called “Hardware Monitor,” “System Health,” “PC Health Status,” or something similar. The exact name depends on your motherboard manufacturer. Use arrow keys to navigate and Enter to select.
Step 4: Locate CPU Temperature
You should see temperature readings for your CPU. This typically displays as “CPU Temperature” or “Processor Temperature.” You might also see individual core temperatures.
Step 5: Exit BIOS
After noting the temperature, exit BIOS without saving changes. Usually press Esc or look for an “Exit” option. Your computer will resume normal startup.
BIOS readings are accurate and reliable, but this method isn’t practical for continuous monitoring. You’d have to restart every time you want to check, which isn’t realistic for daily use.
Third-Party Temperature Monitoring Tools
This is where things get practical. Third-party applications give you real-time monitoring, historical data, alerts, and much more without restarting your computer. Here are the best free options available.
HWiNFO
HWiNFO is arguably the most comprehensive hardware monitoring tool available. It displays detailed information about your CPU, GPU, RAM, storage, and power consumption. The interface looks dated, but don’t let that fool you—it’s incredibly powerful and accurate.
Download it from HWiNFO’s official website. The portable version requires no installation. Open it, and you’ll immediately see your CPU temperature displayed prominently. You can customize which sensors display and set up temperature alerts.
Core Temp
Core Temp specializes in CPU temperature monitoring. It shows temperature for each individual core, which is useful if you want to see if one core is running hotter than others. The interface is clean and straightforward.
Get it from Core Temp’s official site. It’s lightweight and runs in the system tray, so you can monitor temperatures without dedicating screen space.
NZXT CAM
If you want something modern and aesthetically pleasing, NZXT CAM is excellent. It provides real-time monitoring with a sleek interface and creates a history of your temperatures over time. You can view graphs showing temperature trends, which helps you identify patterns.
Download from NZXT CAM’s website. It’s free and requires a (free) account to use fully.
Speccy
Speccy provides a quick overview of your entire system, including CPU temperature. It’s less specialized than Core Temp but more user-friendly for beginners. The interface clearly shows all important system specs in one glance.
Find it at Speccy’s official page. It’s lightweight and perfect if you want something simple without excessive features.
If you’re interested in learning about how to check PC temps more comprehensively, these tools handle everything from CPU to GPU monitoring in one dashboard.

Mac and Linux Methods
For Mac Users
Apple doesn’t make it obvious, but your Mac definitely has temperature sensors. You can access this data through several methods.
The easiest is downloading Macs Fan Control or iStat Menus from the App Store. These applications display real-time temperature data in a user-friendly interface. Macs Fan Control is free and focuses specifically on temperature and fan control. iStat Menus is more comprehensive but requires a paid subscription after the trial period.
For command-line enthusiasts, you can use Terminal. Open Terminal and install Homebrew if you haven’t already, then install “osx-cpu-temp” via Homebrew. This gives you CPU temperature data directly in the command line.
For Linux Users
Linux offers multiple methods depending on your distribution. The most common approach is using the sensors command in Terminal. Open Terminal and type sensors. If it’s not installed, you’ll need to install lm-sensors first using your distribution’s package manager.
For graphical interfaces, try GNOME Logs or KDE System Monitor depending on your desktop environment. These show system temperatures alongside other performance metrics.
If you’re running a server or headless Linux installation, command-line tools like psensors or reading directly from /sys/class/thermal/ directory gives you temperature data without a graphical interface.
Understanding Your Temperature Readings
So you’ve checked your CPU temperature. Now what? Understanding what those numbers mean is crucial.
Idle Temperature
When your computer isn’t doing much—just sitting at the desktop—your CPU should be relatively cool. For most modern processors, idle temperatures range from 30-50°C. Older processors might run slightly warmer, while high-end chips with excellent cooling might stay even cooler.
Load Temperature
When your CPU is working hard—gaming, video rendering, compiling code—temperatures will rise. Expect 60-85°C under heavy load for well-cooled systems. This is normal and healthy.
Maximum Safe Temperature
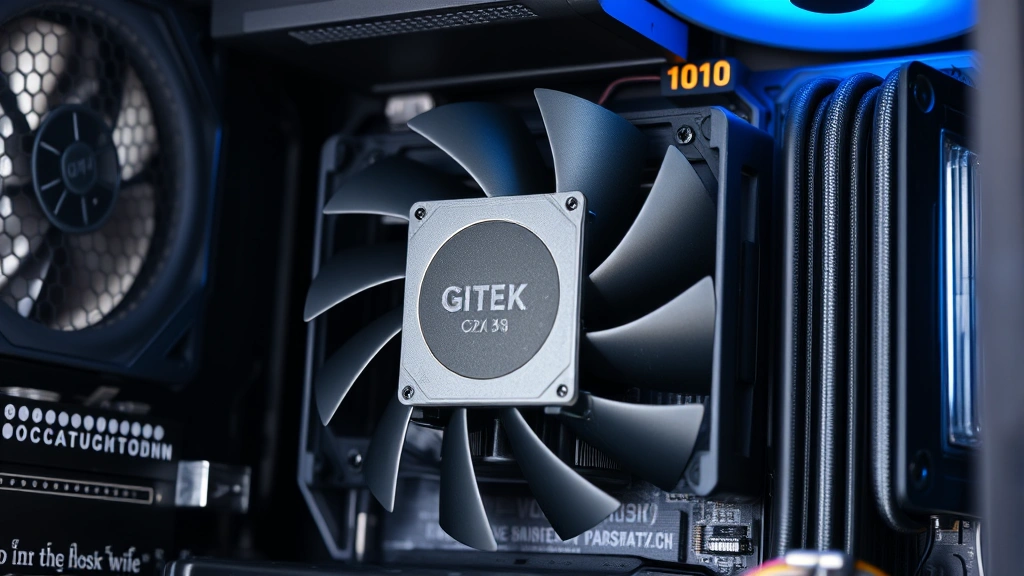
Most modern CPUs have a maximum safe temperature (called Tjunction or Tmax) between 90-105°C. If you’re consistently hitting these numbers, your cooling solution needs attention. Check that your fans are spinning, your heatsink isn’t clogged with dust, and your thermal paste hasn’t degraded.
Red Flag Temperatures
If your CPU is hitting 100°C+ regularly, or if it’s thermal throttling (you’ll notice performance drops during gaming or heavy tasks), something’s wrong. This could indicate inadequate cooling, poor thermal paste application, or a failing cooling solution.
For more detailed guidance on how to check CPU temp and interpreting results, dedicated guides provide manufacturer-specific information.
Troubleshooting High CPU Temperatures
If you’ve discovered your CPU is running hot, here’s what to do.
Clean Your Computer
Dust is the enemy of cooling. Fans can’t move air effectively when they’re clogged, and heatsinks become insulated by dust buildup. Power down your computer, unplug it, and use compressed air to clean the fans, heatsink, and case vents. Hold the fans still while cleaning so they don’t spin freely (spinning fans can damage bearings).
Check Fan Operation
Make sure all your fans are actually spinning. If a fan isn’t running, replace it. Most desktop fans are inexpensive and straightforward to swap out.
Reapply Thermal Paste
If your computer is older or you’ve had it for several years, thermal paste might have degraded. This paste conducts heat from your CPU to the heatsink. When it dries out, thermal transfer becomes inefficient.
This requires removing your heatsink and CPU cooler. Clean the old paste off both the CPU and heatsink using isopropyl alcohol and a lint-free cloth. Apply a small rice-grain-sized amount of new thermal paste to the center of your CPU. Reinstall the heatsink. Proper application makes a huge difference—too much paste actually insulates rather than conducts heat.
Improve Case Airflow
Make sure your case has proper ventilation. Front fans should pull cool air in, and rear/top fans should exhaust hot air out. If you only have fans on one side, consider adding intake or exhaust fans to create better airflow.
Check for Thermal Throttling Settings
Some BIOS settings can artificially limit your CPU performance to reduce heat. Look in BIOS for “Thermal Throttling” or “CPU Power Management” settings. Make sure they’re configured appropriately for your needs.
If you’re experiencing issues beyond temperature monitoring, you might want to learn about other system maintenance tasks. For instance, if your device is acting sluggish, how to powerwash a Chromebook might be relevant if you’re using a Chromebook, or you could explore how to format SD card if storage issues are contributing to performance problems.
Frequently Asked Questions
What’s a Normal CPU Temperature?
Normal idle temperatures range from 30-50°C depending on your processor and cooling solution. Under load, 60-85°C is typical for well-cooled systems. Anything consistently above 90°C indicates a cooling problem.
Should I Monitor CPU Temperature Constantly?
You don’t need to obsessively monitor it, but periodic checks are wise. If you’re pushing your system hard (gaming, rendering, heavy workloads), check temperatures occasionally to ensure everything’s running healthy. Most people check once a month or when they notice performance issues.
Can High CPU Temperature Damage My Computer?
Yes. Sustained high temperatures degrade your CPU over time and reduce its lifespan. Extreme temperatures can cause immediate shutdown or permanent hardware damage. That’s why monitoring and addressing temperature issues matters.
Why Is My CPU Temperature Different in Different Programs?
Different monitoring tools can show slightly different readings because they access sensors differently or use different measurement methods. Differences of 2-3°C between tools are normal. If one tool consistently shows much higher temperatures than others, it might be misconfigured or the sensor might be faulty.
Is It Normal for CPU Temperature to Vary?
Absolutely. Temperature fluctuates based on CPU workload, ambient room temperature, and fan speed. You’ll see temperature changes within seconds as your processor handles different tasks. This is completely normal.
Can I Lower My CPU Temperature?
Yes. Clean your computer, reapply thermal paste, ensure fans are working, improve case airflow, and make sure your cooling solution is appropriate for your CPU. These steps typically reduce temperatures by 5-15°C.
What Monitoring Tool Should I Use?
For most users, HWiNFO or NZXT CAM are excellent choices. HWiNFO is more detailed and technical, while NZXT CAM has a modern interface. Core Temp is perfect if you only care about CPU temperatures. Choose based on what features matter to you.
Do Laptops Run Hotter Than Desktops?
Generally yes. Laptops have limited space for cooling solutions and can’t dissipate heat as effectively as desktops. Laptop CPUs also typically have lower maximum safe temperatures than desktop processors. If your laptop regularly exceeds 85°C, that’s concerning.


